
Supreme Industries: What Is Driving the Current Fall?
Supreme Industries Ltd Weekly chart with Elliott Wave and EMA
Sep 17, 2026
Analysis
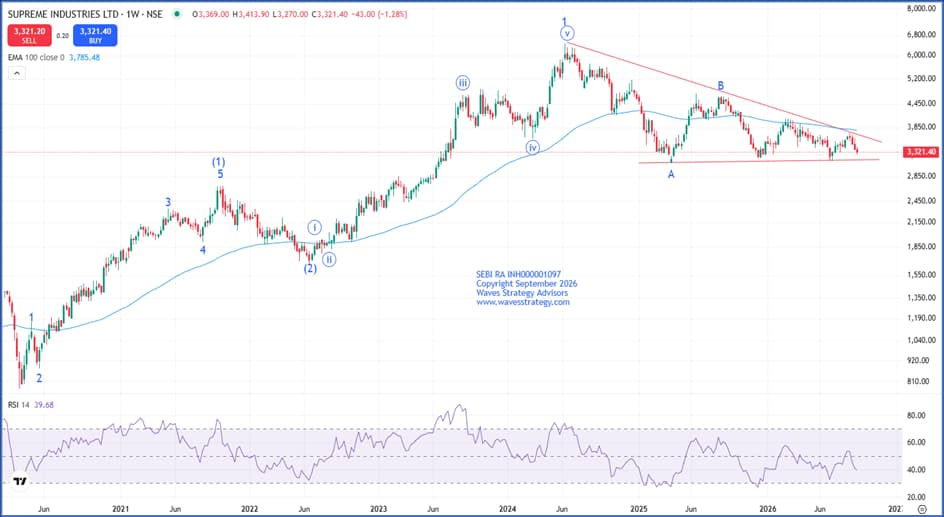
Supreme Industries has been following the classic Elliott wave theory since Covid fall of March 2020.
The stock completed its primary wave (2) back in June 2022 near 1700 level and now the wave (3) is currently ongoing on the upside.
In which the rally from June 2022 – June 2024 was in the form of Intermediate wave 1 of (3) which got completed near 6500 level generating almost 300% in the span of 2 years highlighting the power of wave (3).
Currently, the stock is trading within the Intermediate wave 2 which is unfolding in the form of Zig Zag pattern as wave B has retraced less than 61.8% of wave A. Now, the wave C of 2 is currently ongoing on the downside.
Also, stock is comfortably trading below 100 period EMA (Exponential Moving Average) since November 2025 which is negative sign. Stock may remain under control of bears as long as the stock remains below 100 period EMA.
Along with that, prices have been trading within a Triangle pattern in which the stock recently took resistance from the upper part of the Triangle pattern and is now heading lower towards the bottom part of the same.
Conclusion
The combination of Elliot wave, chart pattern and indicator suggest that the stock is on the side of bears.
For now, a break below 3270 level can drag prices lower toward 3140 or lower as long as 3710 stays protected on the upside.